
The Physics of Golf
![]()
by Martin Paul Gardiner
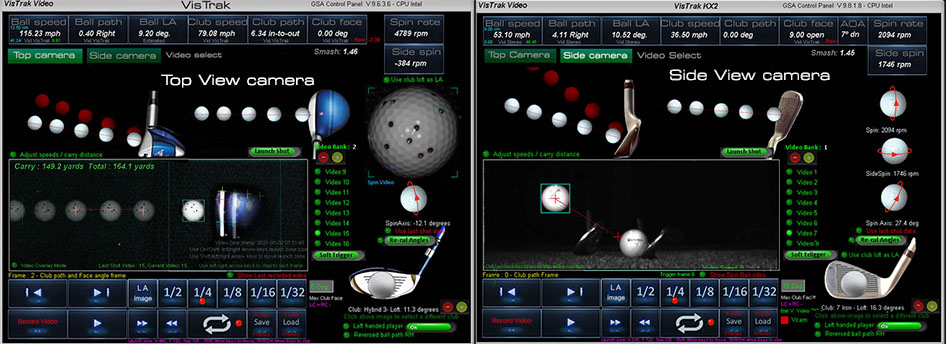
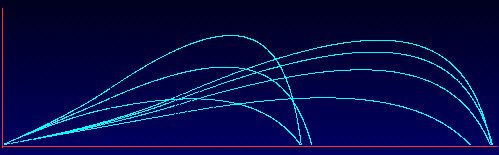
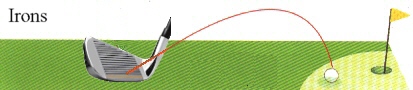
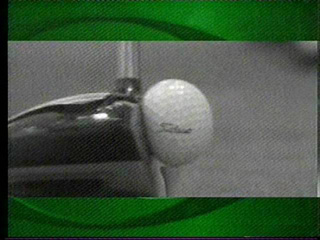
Click above images to see shot videos made with GSA Golf high-speed cameras.
![]()
In order to calculate and produce a realistic ball fight trajectory in the simulator, I had to do quite a bit of research into the physics of golf.
Here are some of the aspects that I have taken into account that might be of interest to you.
Dimples on the ball and the Magnus effect
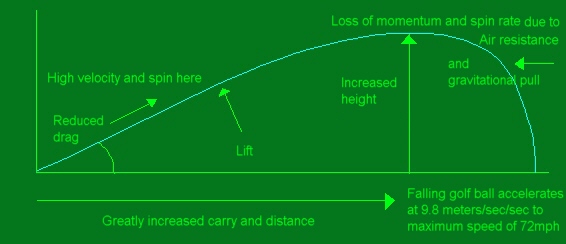
As you probably already know, the dimples on the golf ball are there to give the ball more lift and reduced drag during its flight and therefore increase its carry through the air.
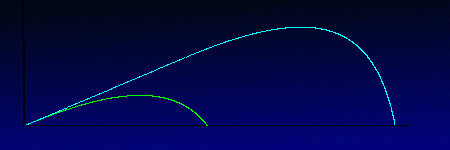
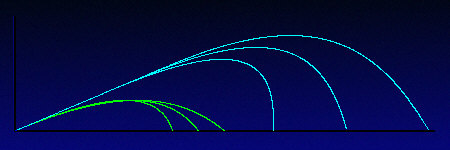
This graph - which was generated by the GGS trajectory calculation routines - shows just what a difference those little dimples actually make to the distance the ball will travel.
As you can see, a ball with the appropriate depth dimples and top spin will travel far further than a ball with no dimples at all.
Those little dimples actually scope the air on its front and top surface and throw it back behind the ball.
This causes turbulence which prevents the pressure behind the ball from falling and thus the pull back effect that would have.
It also causes the air-flow above the ball to travel faster and thus the pressure on the ball from the top to be lower than the air pressure below the ball.
This pressure difference (i.e. more relative pressure from below than on top) causes the ball to lift and stay in the air for a longer time. This phenomenon is known as the Magnus effect

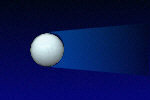
Drag behind a spinning golf ball with and without dimples
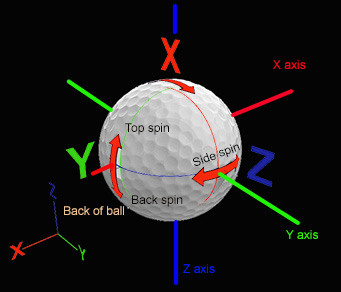
Ball Spin
This pushing and lifting effect is dependent on the top-spin rate of the ball. When the ball is struck properly by a lofted club, the ball will tend to travel or roll up the club-face before it is launched.
This causes the ball to anti-clockwise spin at a rate governed by the speed, loft and surface friction of the club head face at impact. Typical ball spin-rates are:
3,600 rpm when hit with a 10° driver (8° launch angle) at a velocity of 134 mph
7,200 rpm when hit with a 5 iron (23° launch angle) at a velocity of 105 mph
10,800 rpm when hit with a 9 iron (45° launch angle) at a velocity of 90 mph
Topping the ball (i.e.. when the bottom of the club-face hits the ball above its center) will cause the ball to spin in the other direction - i.e.. downward - which will cause the ball to dive into the ground.
With really high spin rates the magnus lifting effect will actually increase the ball's rate of climb. The effect is known as blow-up and usually remains the domain of the real hard hitters.
Of course the wind strength and direction will also affect the ball's flight.
Apart from this top and bottom spin around the ball's horizontal axis, there is also the amount of side spin that the ball may have. The side spin is induced by the club hitting the ball with an open or closed face at a path other than 90° to the ball's intended direction.
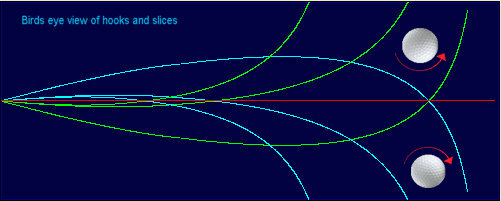
The Slice
Hitting the ball with an open club-face and a club-path from out to in will cause the ball to spin from left to right. The ball's flight will then curve to the right or 'Slice'.
The Hook
Hitting the ball with a closed club-face and a club-path from in to out will cause the ball to spin from right to left. The ball's flight will then curve to the left or 'Hook'.
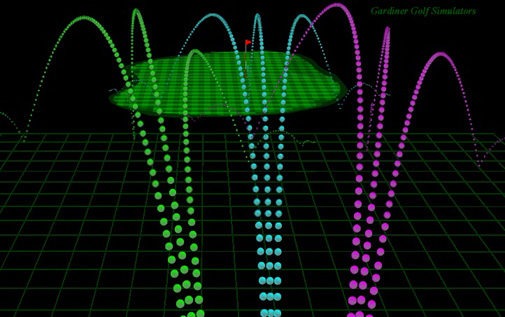
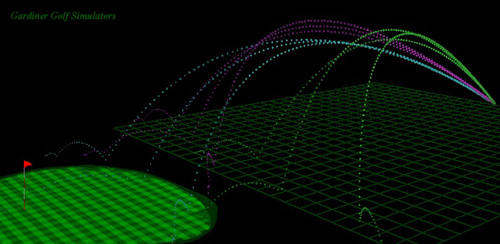
Golf ball flight trajectory traces in the GSA Golf system.
From left to right: Pull-hook, pull, pull-slice, straight-hook , straight, straight-slice, push-hook, push and push-slice.
![]()
Average Distances
3-IRON : 170-190 yds (155-174m)
4-IRON : 160-180 yds (146-163m)
5-IRON : 150-170 yds (137-155m)
6-IRON : 140-160 yds (128-146m)
7-IRON : 130-150 yds (119-137m)
8-IRON : 120-140 yds (110-128m)
9-IRON : 110-130 yds (101-119m)
Pitching : 90-110 yds (82-101m)
Sand Wedge: up to 80 yds (73m)
DRIVER : 200-240 yds (183-219m)
3-WOOD : 190-220 yds (174-201m)
5-WOOD : 170-190 yds (155-174m)
7-WOOD : 160-180 yds (146-165m)
Nows the time to put all this physical theory into practice.
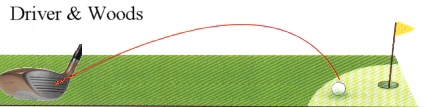
If a golf ball didn't have any dimples and we neglect any other aerodynamic effects such as drag and wind, then the trajectory calculation is really very simple.
For any given time (t) the distance traveled (x component) is
and the height (y component) at any given time (t) is
where Vo = initial velocity of ball
g = gravitational acceleration 9.8 m/s/s
m = the launch angle in radians
All simple stuff but unfortunately - for me that is - a golf ball's trajectory is not that simple and thus not that simple to calculate.
First off we've got that Magnus effect (lift on a spinning dimpled ball) to apply. In my system I have used the following formula to estimate the Magnus lift force :
where d = density of air at 60° = 2.37 * 10-³
v = velocity
r = ball radius
av = angular velocity in radians per second (if you have spin, n, in rpm, them av = (2pi n)/60
An adapted version of the same formula is also used to determine the force on the x plane (left/right direction) which causes the ball to curve.
The vertical and horizontal spin rates of the ball are calculated from the incoming data feed from the sensor mat in the system.
Then we have the wind force and air drag to deal with which acts on all of the 3 dimensions of the flight (x,y,z) whereby
x is the left/right direction/deviation of the ball flight
y is the height
and z the distance traveled ahead
The drag force can be written as:
Fd = -Cdv
Fd = -Cdvx -Cdvy -Cdvz
where Cd is the drag coefficient, v is the velocity of the ball (vx,vy,vz are its components) and the minus sign means that this drag force opposes the ball's motion.
The side view of the trajectory will then look something like this.
Terminal velocity
Due to air resistance a falling golf ball will not continue on accelerating at the rate of 9.8 meters / per second / per second.
It will eventually reach a maximum falling velocity dictated by its mass and area.
This velocity is known as Terminal Velocity and in the case of a golf ball with a radius of 2.1 cm, an area of 14cm² and a mass of 46 grams, this will be 32 meters per second or 72 mph.
Wind force
Wind force is defined as
Fw = -Cwvw
where Cw is the drag coefficient and vw is the wind speed.
Defining the wind direction as measured by angle y I use the following formulas to determine the x and z components of the wind force on the ball:
Fxw = Fw cos y = -cos y(Cwvw)
Fzw = Fw cos y = -sin y (Cwvw)
If there is any side spin on the ball - and there usually is - then the ball will curve in the direction of the spin.
Side wind will, of course, cause the ball to curve in its direction and head or tail wind will affect the ball's carry.
Also of interest is the research work done by P.W. Bearman and J.K. Harvey (P.W. Bearman and J.K. Harvey - Golf ball aerodynamics, Aeronautical Quarterly, pp. 112 - 122, May 1976 ) The following formulas are used to calculate the height, distance, acceleration and velocity of a flying golf ball for any given time t - n=0 to n= (until ball hits ground)
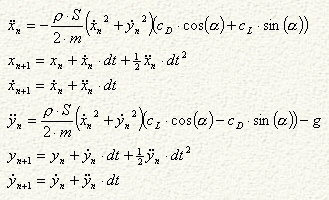
Where:
p is density of air at sea level = 1.225 kg/m3
S is on stream surface ( = pi r², r = 20.55 mm) = 1.3267×10-³ m²
'm' is mass of the ball = 0.050 kg
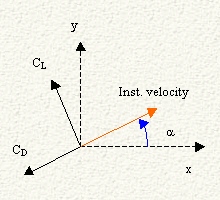
a is the instantaneous angle between the instantaneous velocity and the horizon.
CD is the drag coefficient, which has the same direction as the instantaneous velocity.
CL is the lift coefficient, which direction is perpendicular to the instantaneous velocity.
dt is the time step ('step size'). After every time step the simulation will be recalculated.
'x' is the coordinate in the direction of the range.
'y' is the coordinate in the direction of the height.
When the clubface collides with the ball it's total contact time is approximately 0.0005 seconds and the peak force applied to the ball can be as high as 4000 pounds
.
This high force actually compresses the ball at impact.
Due to the elasticity of the ball (compression) and the clubface (Metal woods) the ball will be launched at a higher velocity than that of the club head at impact. Average factors are 1.46 for a driver, 1.30 for a 5 iron and 1.12 for a 9 iron.
i.e. the ball's speed just after impact will be this factor greater than the club head speed
![]()
Calculating ball launch velocities
Formulas used to determine this increase in ball velocity are:
vball = ((velc*(1.67))/(1.0+(ball/mass)))
where :
vball = the velocity of the ball
velc = club head speed.
ball = mass of ball
mass = mass of club head
and 1.67 = coefficient of restitution
The coefficient of restitution (1.67)
accounts for momentum loss and the fraction of the energy into a collision that a collision "gives back."
Including the loft of the club the formula is:
vballi = ((cos (loft))^2*(sin(90-loft))*vball
where:
Vballi = Velocity of the ball after impact with a
lofted club
vball = ((velc*(1.67))/(1.0+(ball/mass)))
loft = Loft of the club
90-loft = The compliment of the loft of the club
vball = The velocity of the ball determined by the previous formula.
![]()
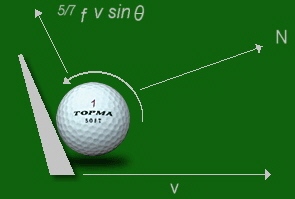
Calculating Spin Rates
The equation 5/7 f v sin 0 is used to calculate the vertical velocity of the ball traveling up the club head face where f is the fraction of speed remaining when the compression of the ball is considered, 0 is the angle of the clubface at impact and v is the velocity of the club head.
To calculate the side spin I use an adapted version of the same formula using the degrees the clubface is open or closed in relation to the club head path.
Knowing the ball velocity and the circumference of the golf ball the theoretical spin rate can be calculated as:
spin rate in rpm = (bv / c) /60
where c = circumference of the golf ball = 0.043m and bv = 5/7 f v sin 0
Both top spin and side spin are used to produce a ratio of the true spin rpm and direction
i.e. if top spin = 3600 rpm at 0° and side spin = 900 rpm at 90° or -90° (left or right) then
ratio = 900:3600 = 0.25
assuming a ratio of 1:1 would result in a spin direction (or axis tilt) of 45°
then spin direction = 45° * 0.25 = 11.25°
![]()
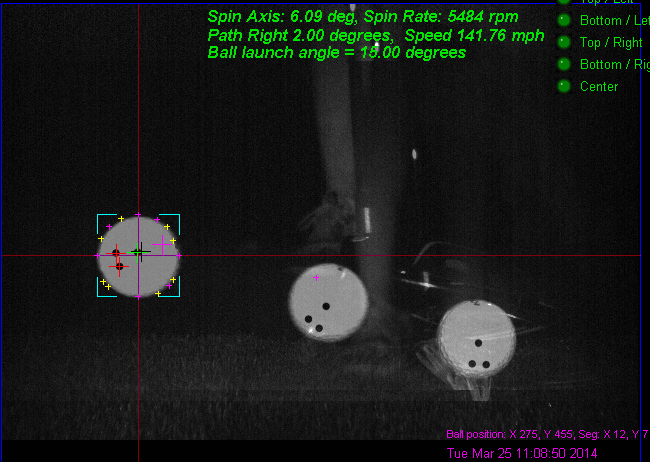
Measuring spin rate
using the GSA Golf LX launch monitor
 --
--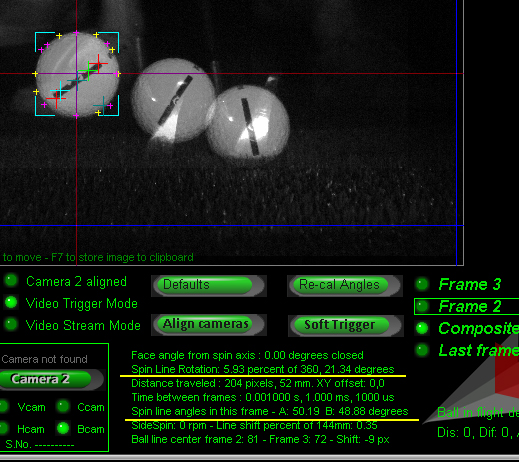
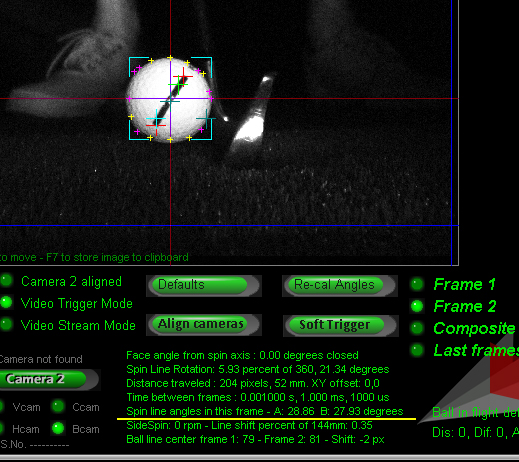
Spin rate is measured by comparing the ball line angles in frame 2 and frame 3.
If we subtract the angle in frame 2 from the angle in frame 3 then we'll have the number of degrees of rotation within the 1 millisecond time frame.
For increased accuracy the image processing makes two spin line angle measurements: A and B.
Angle A cross hairs are in red and angle B cross hairs are in cyan.
In the above example, frame 2's spin line angles were 28.86 and 27.93 degrees and frame 3's spin line angles were 50.19 and 48.88 degrees
Subtracting A angles we get 50.19 - 28.86 = 21.33 degrees
(Rounding in the above example accounts for the 0.01 difference. i.e. 21.34 instead of 21.33)
If we know the ball rotated 21.34 degrees in the 1 millisecond frame time we can calculate the time it would take to rotate 1 degree in that time by dividing the 1 millisecond by the number of degrees of rotation.
So time required for 1 degree of rotation is 0.001 / 21.33 = 0.00004689 seconds
As there are 360 degrees in a complete rotation we multiply this time by 360 to give 0.01687 seconds.
So we have one complete 360 rotation every 0.01687 seconds which equates to 59.27 rotations (1/ 0.01687) every second and 3556 (59.27 * 60) rotations in one minute.
Spin rate in rpm is thus 3556 for this shot
Spin Axis detection
In oder for the LX to detect spin axis in addition to spin rate, the complete logo or markings on the ball must be visible in all frames.
Thus, using a ball with a line or logo markings that go all around won't work as we need to see both ends of the markings in order to determine the center of rotation.
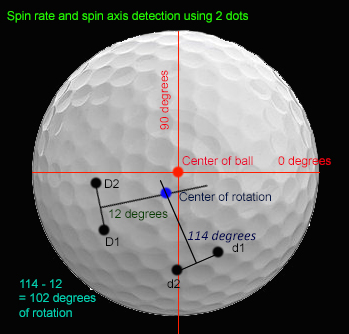
Spin Axis detection theory
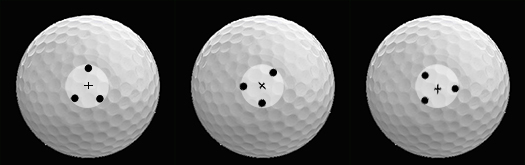
Using 3 dots that form an isosceles triangle - ie a triangle with only two sides equal so that we can see the rotation angle - both spin rate and spin axis can be calculated.
The above image shows a ball spinning on a perfect horizontal axis with the dots at the center of rotation. With this - albeit rather unlikely scenario - the dot rotation is exactly in the center of the ball and thus it can be easily determined that the spin axis is horizontal.
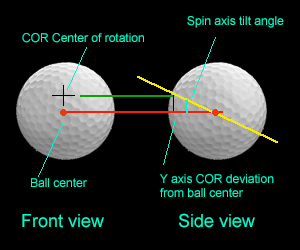
If the dots are always in the center of rotation - again extremely unlikely - then calculating spin axis would be a simple matter. i.e. we just have to measure the center of rotation offset to the center of the ball and apply this to some simple trigonometric math to determine the spin axis.
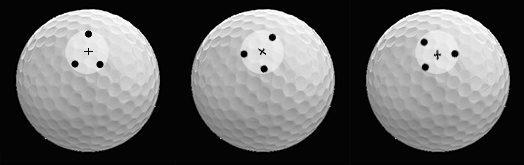
The more likely scenario is that the spin dots are way off the center of rotation but - as shown above - it is still possible to determine the center of rotation by following the rotational path of the dots.
Again, once the center of rotation has been determined and it's distance away from the center of the ball is calculated, we can determine the spin axis.
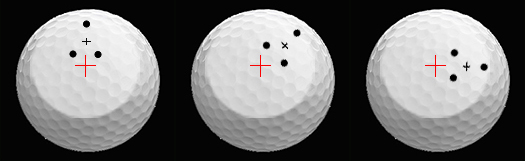
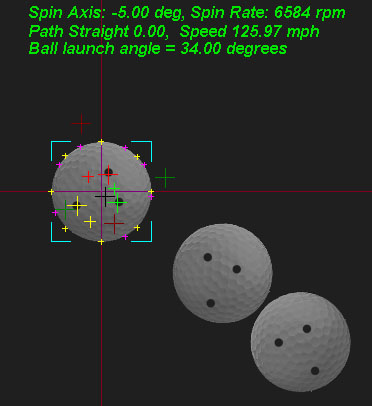
Above image shows latest results of the new dot triangle method of detecting the spin and spin axis of the ball. Center of rotation is shown with the black cross hairs.
Red and green cross hairs have been programmed to not only find the dots but to also find the center of the dots. The pink cross hair shows the perpendicular to the triangle.
The black cross hair is the position of the intersection of the the triangle's perpendiculars in frames 1 and 2. This is then the center of rotation.
Once the center of rotation has been detected, simple trigonometry is used to calculate the spin axis.
 -
-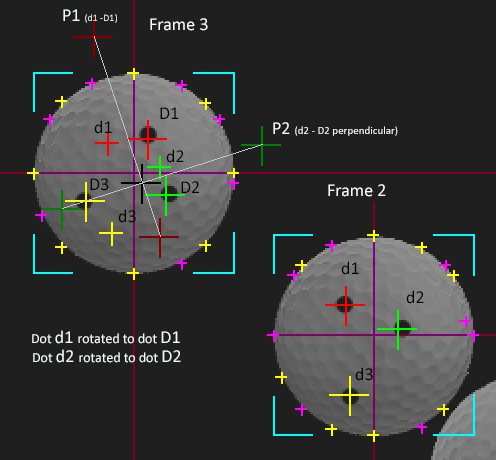
LX cross hairs explained: The above images show dots 1,2 and 3 in frames 2 and 3. The red cross hairs are always dot 1, the green dot 2 and yellow dot 3.
All spin calculations are done in frame 3. The smaller red, green and yellow cross hairs in frame 3 show where the dots were in frame 2. The larger and fainter red and green cross hairs show the perpendiculars of the dot sets.
The point where these perpendiculars intersect is shown as a black cross hair. This is the center of rotation of the dots on the ball. From this intersect point we can calculate the spin axis.
![]()
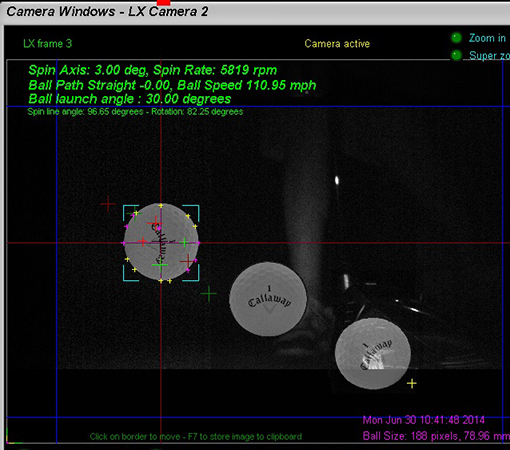
Measuring spin rate and spin axis with the GSA Golf Vcam camera
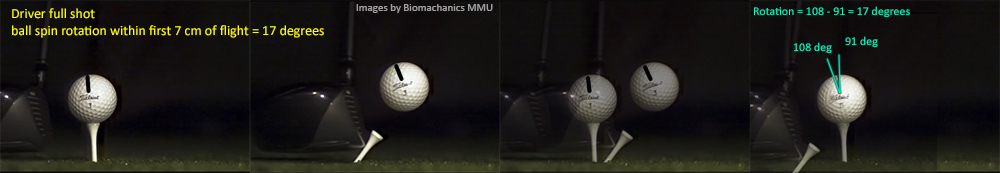
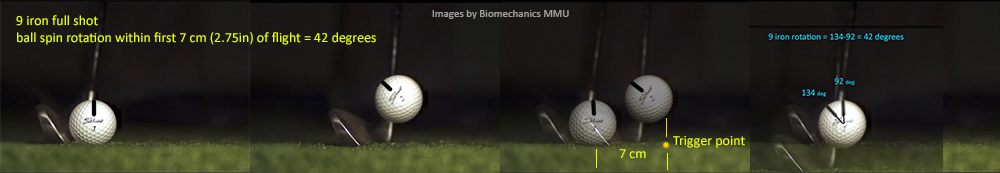
The slow motion golf impact videos from the MMU Biomechanics department on YouTube (click above YouTube image) where used to confirm that the ball spin rotation
within the first 5 to 7cm of flight is visible to the Bcam camera when mounted overhead and that this first part of the spin is consistent and can be used to calculate the spin rate in rpm.
Overhead mounted
The main advantage with the overhead mounted position of the Vcam is that it works for both left and right handed players without having to move the unit.
Another advantage is that side spin is visible and can be measured.
The main disadvantage is that the ball has to be placed on the mat or tee with the marking facing upwards for every shot which usually means that the player has to bend down and align the ball manually.
Side mounted
The main advantage with the side mounted position of the Vcam is that balls with spin dots marked all around the ball can be used, saving the player from having to bend down and and align the ball for every shot.
Another advantage is that spin tilt can be directly measured whereas tilt with the overhead mounted position has to be derived from side spin. (we're not sure which is more important at the moment though).
The main disadvantage is that the unit must be moved to the other side for left handed players.
This is due to the requirement to capture the ball in flight just as it launches and if the unit is placed on the right side of the enclosure for right handed players then the legs of a left handed player would obstruct the view of the ball.
Moving the unit further forward to so that the view is not obstructed won't work as the Bcam is a single camera system and the ball will probably have rotated more than 360 degrees
- i.e. it has rotated numerous times - by the time it is in the FOV of the camera.
Thus the system won't know how many revolutions it has made before hand and as it only has one frame of the ball in flight, can't calculate the spin.
To solve that issue, two frames of the ball in flight would be required which would only be possible at this high frame rate using two cameras. i.e. you'd need two Bcams.

![]()
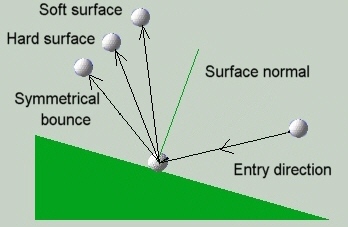
Bounce

When the golf ball eventually hits the ground, it will tend to bounce a number of times whereby the height and angle of the bounce is very dependent upon what type of surface it hits.
When the golf ball hits a hard surface like a footpath, then the bounce will be very profound (aprox. 50% of its falling height).
However, most of the time it will hit the fairway or the green - hopefully - or maybe in the rough. Here the energy absorbed by this type of surface is very significant and the ball will only bounce a fraction of what it would if it had hit a hard smooth surface.
In my system I have created formulas that take all these factors into account including the deviation the angle of bounce will have on inclined soft surface.
This is not the same as on a hard surface like a footpath or hitting a tree trunk. On a hard surface we can say that the angle the bounce flight will be near the angle of impact reversed.
However, on a soft(er) surface, because of the energy absorbed, the angle of bounce launch will be more towards the surface angle normal.
After the ball has stopped bouncing and landed it will tend to roll for a certain distance. If the plane is horizontal then the amount of roll can be calculated from its velocity and the friction of the surface.
If, however, the ball lands on an inclined plane, then we have to take into account the force the angle of the plane will have on the ball.
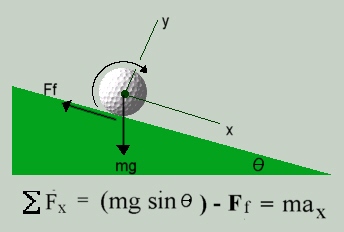
The above formula is used to calculate the force on the ball in the x direction up and down a plane, where mg is the force due to gravity, Ff the opposing force due to friction and ax
is the linear acceleration in the x direction. The friction force is equal to us N where us is the coefficient of friction of the surface and N is the normal reaction force between the ball and the plane.
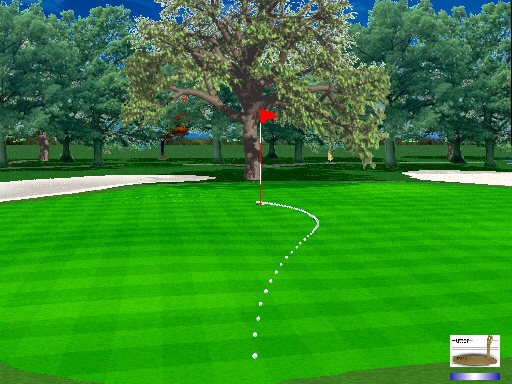
Things start to get a bit complicated - to say the least - when the ball is rolling on a contoured surface like a green.
Here I have to make continual calculations and adjustments to the direction and speed of the ball taking into account the momentum the ball has in a certain direction.
At each time step I check the slope angle and direction and calculate a curve for the ball to follow depending on the magnitude of the force the slope is exerting on the ball.
If, at any following steps this slope changes, I recalculate the curve and apply this to its current path at a rate governed by its current velocity or momentum.
When all the calculations of the flight trajectory, bounce and roll are done, the results are stored in a table.
This table contains the 3 dimension (z,x and y) co-ordinates of all the steps and is in turn read by the flight routines.
When the system gets the launch (fire) command from the sensor mat and all the club head and clubface angle and velocity data have been read, the system calculates the trajectory and a timer is started to produce timer events at 0.05 second intervals.
The timer event handler then reads the next coordinates for the step from the flight trajectory table, removes the image of the ball on the screen at the last step and displays it again at the new position.
The 'Trajectory Trail On" feature of the system prevents the system from removing the ball image so the user can see the exact trail of the trajectory. This feature had been switched on for all the screen shots shown on this site.
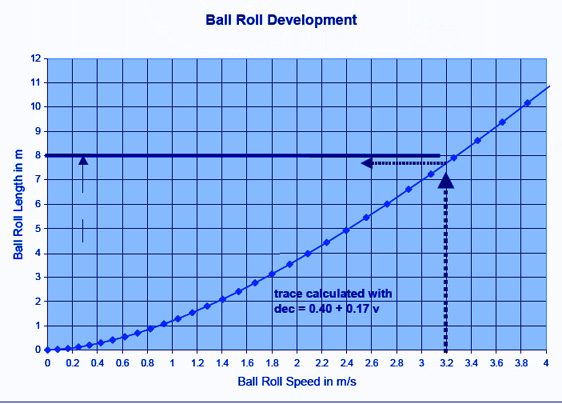
The above graph shows the distance a ball will roll for a given initial velocity and a given green speed.
The GSA Golf system allows you to vary the graph used in the ball roll calculations from linear to exponential as well as the green speed.
Ball Velocity/Carry Graph for all clubs
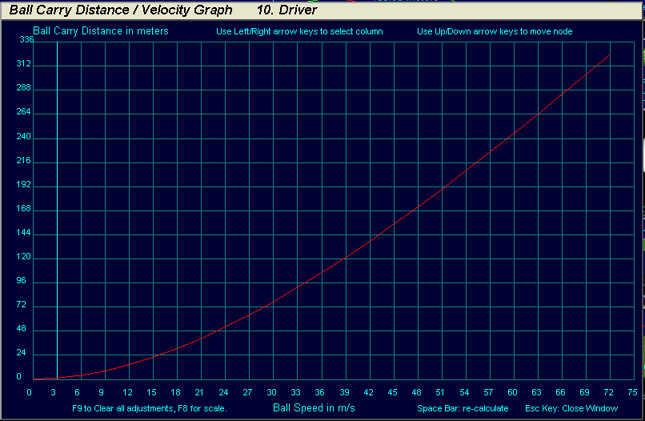
You can see and adjust the ball carry for every club and for every ball velocity.
"C makes it easy to shoot yourself in the foot; C++ makes it harder, but when you do it blows your whole leg off."
-
 Home
Home Sensors
 Cameras
 Software
 Enclosures
 GSA Courses
 E6 Courses
 Business
 Tech News