![]()
Golf Simulator Theory
![]()

Hi! I'm Martin Paul Gardiner
Electronics and software development engineer and founder of GSA Golf
Below is a number of my golf simulator research and development details - made over the years - that may be of interest to you.
Please feel free to contact me anytime if you have any questions.
![]()


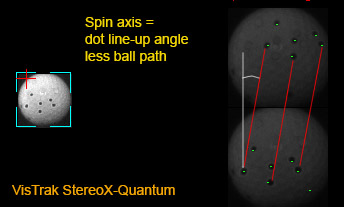
VisTrak Ball Spin detection theory
![]()
Measuring spin rate from an overhead camera system
 -
-

Measuring spin rate from an overhead camera using just the ball logo as reference and waiting for a complete 360 revolution.
This method requires capturing multiple frames of the spinning and moving ball.
To measure spin rate using just one reference marking (i.e. the ball logo), the captured frames would have to include a complete 360 rotation of the ball.
If the ball was just spinning and not moving forward, we could calculate spin rate by just counting the number of frames (and thus time) required for a complete 360 degree rotation,
Unfortunately for us here - in the game of golf - the ball is moving very fast, and thus hi-resolution frames have to be captured over a (competitively) long distance.
Example 1: assuming a ball speed of 150 mph and a frame rate of 800 fps = 1/800 = 1 frame per 0.00125 seconds
1. 1000 rpm = 7.5 degrees of ball rotation per frame = 360/7.5 = 48 frames required for a complete revolution. Distance ball has moved at 150mph in 48 x 0.00125 = 0.275ft x 48 = 13.25 ft
2. 2000 rpm = 15 degrees of ball rotation per frame = 360/15 = 24 frames required for a complete revolution. Distance ball has moved at 150mph in 24 x 0.00125 = 0.275ft x 24 = 6.6 ft
3. 4000 rpm = 30 degrees of ball rotation per frame = 360/30 = 12 frames required for a complete revolution. Distance ball has moved at 150mph in 12 x 0.00125 = 0.275ft x 12 = 3.3 ft
4. 8000 rpm = 60 degrees of ball rotation per frame = 360/60 = 6 frames required for a complete revolution. Distance ball has moved at 150mph in 6 x 0.00125 = 0.275ft x 6 = 1.65 ft
As can be seen from the above calculations, measuring ball spin using just the ball logo and a FOV of a camera mounted at 9ft with a 12mm lens won't work.
i.e. the ball will be out of the FOV of the camera in most spin rate cases.
In order to resolve the issue, the FOV of the camera and lighting would have to be substantially increased using a 6mm lens - which isn't going to be practical
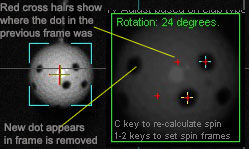
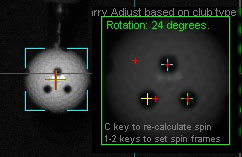
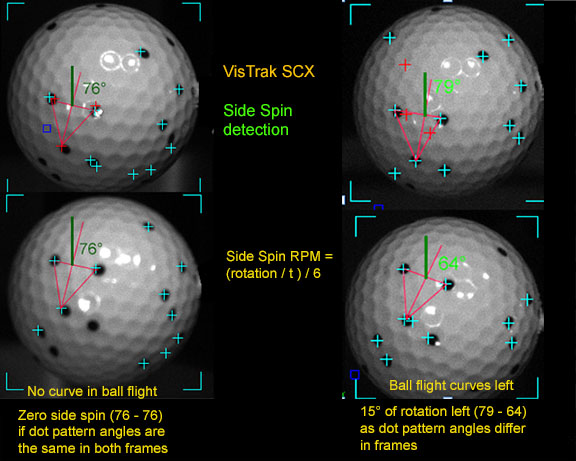
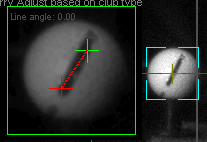
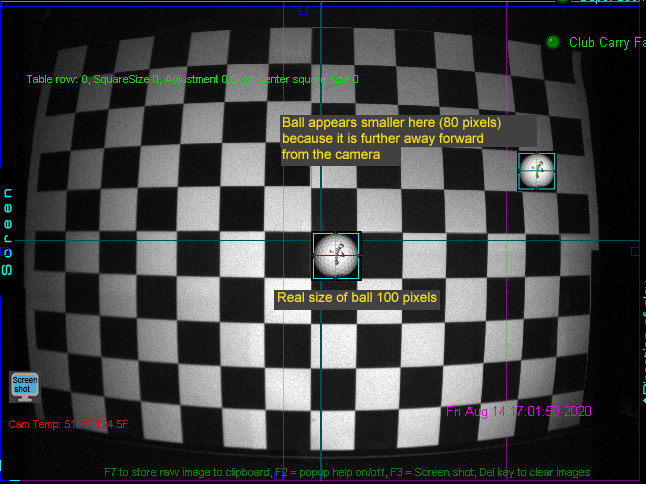
Measuring spin rate from an overhead camera using just the ball logo as reference and measuring a partial rotation between frames.
This method would seem to work nicely as the amount of rotation is under 70 degrees per frame and thus in the FOV of the camera (see above image), plus the ball would only have moved 0.275 ft between frames at 150 mph.
The downside to this method is that either the ball has to be placed on the hitting surface with the logo facing upwards to the camera or multiple frames have to be searched that show the ball logo in two consecutive frames.
![]()
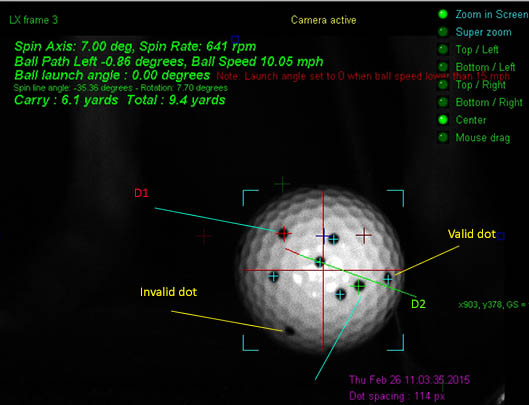
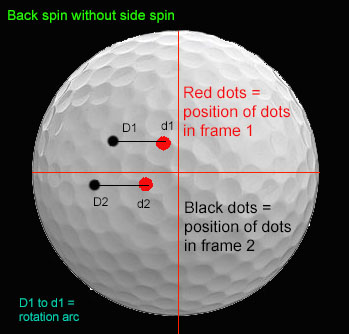
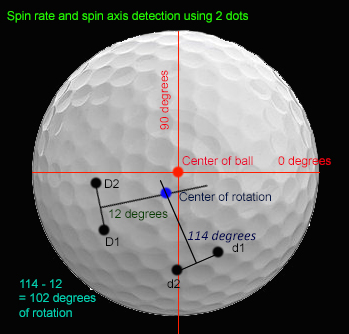
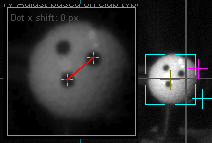
Measuring spin rate from an overhead camera using balls with 360 degree markings as reference and measuring only partial rotation between frames.
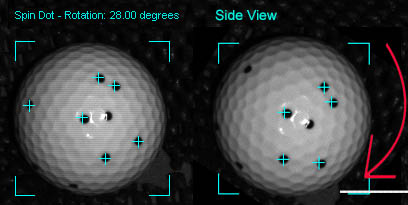
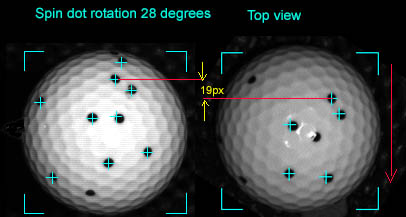
Measuring spin from an overhead camera using spin dot balls as reference and measuring a partial rotation between frames.
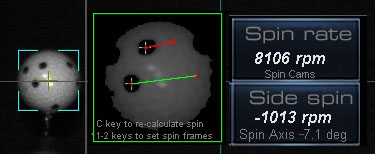
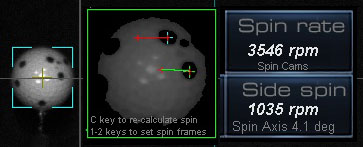
Rotation and spin axis in this case is calculated by comparing x and y spin dot deviation positions between frames
This method is the fastest and most convinient for the player as the ball doesn't have to placed in any particular position on the mat.
However, bright sharp images have to be captured i.e. with minimal motion blur.
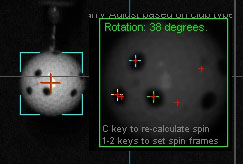
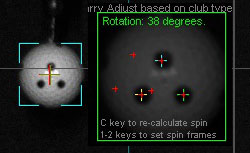
Note that only well defined and spaced spin dot balls can be used ( as hown above).
And that camera exposure time (i.e. shutter speed) has to be set at or below 150 micro seconds and frame set to 1500 fps
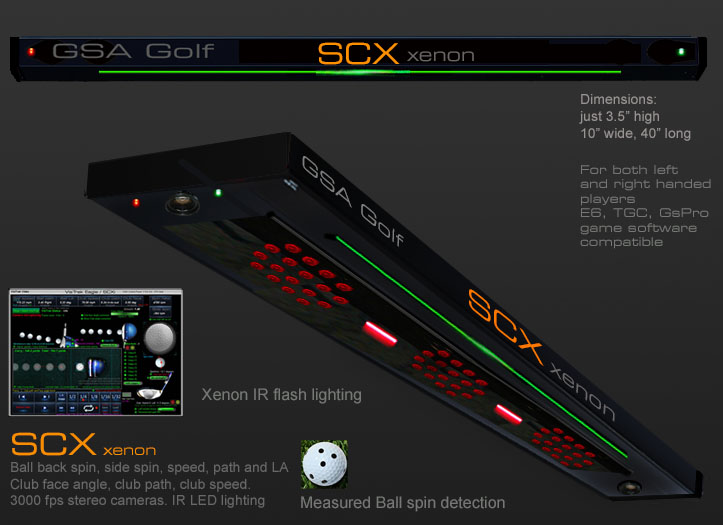
Frame timing for the SCX overhead ball spin detection camera
Amongst many other things, I've had to work out the frame timing for the SCX ball spin camera.
i.e. the time between capturing the first frame for the spinning ball and the second frame.
In order to do this, we need to know what the linear speed of a ball rotating at a certain RPM is
This is calculated as follows:
w = RPM / 60 second/minute ×2π rad/rev
where w = angular velocity and rad = radians
v=ωr = linear speed
Example: the linear speed of a ball rotating at 8000 rpm would be :
838 rad/s x 0.021 m (radius of golf ball) = 17.598 m/s
Time required for the ball to rotate by 20 mm at this speed = 1.16 ms
where 20mm is the max amount of linear distance the camera will be able to see in one revolution.
Thus a 1 ms time between frames should be sufficient to capture up to 10,000 rpm.
Accuracy of the overhead mounted SCX spin camera works out to be around +/- 50 rpm.
Accuracy of the side floor mounted spin detection cameras work out to be +/- 2 rpm.
The increase in accuracy of the side floor mounted spin cameras is due to the fact that a full 360 degrees of rotation is visible
whereas only 70 degrees of rotation per frame is visible if the cameras are viewing the ball from above.
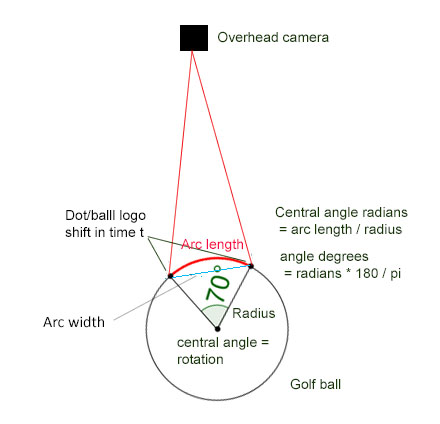
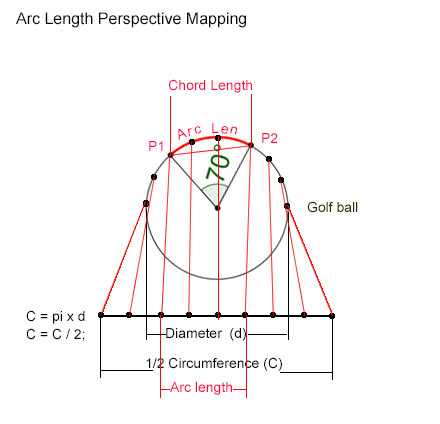
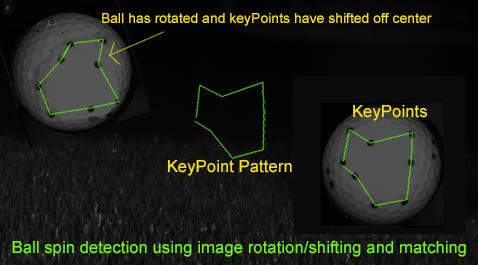
Calculating spin rate from arc length spin dot shift
SCX systems view ball from above. Rotation and spin axis is calculated by comparing x and y spin dot deviation positions between frames
A little math is required to deduce the spin rate from the circle arc measured from the rotating and shifting key point pattern on the ball.
Knowing the circle arc length (i.e. the vertical shift of the key point pattern on the ball as viewed from above) and the radius of the ball, the arc central angle can be calculated.
This arc central angle is the rotation in degrees (or radians) for a given time between the two frames (1 ms) and from this, the spin rate can be calculated.
In order to measure the degrees of ball rotation from an overhead camera system that only sees the arc width (chord),
a number of calculations have to be made.
1. Calculate arc length from arc width and ball image radius
Using the formulas:
first find S = height of arc (sagitta or sag)
S = r - sqrt(r² - L²)
r = radius. L = half arc width (chord).
Then find arc length
ArcLen = (π (L² + S²) arcsin (2LS/(L² + S²)) / 180L
2. Calculate degrees of rotation given Arc length and ball radius
Using the formula: CA (Central Angle) = ArcLen * 360 / 2 π r
3. Given time t and the amount of rotation within this time, calculate spin rate in rpm
Using the formula: Spin rate rpm = (r/t) / 6
where r = degrees of rotation
and t is the time in which the rotation occurs.
Divide by 6 to get RPM
Spin rate in RPM = w / 6
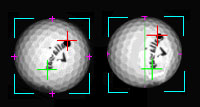
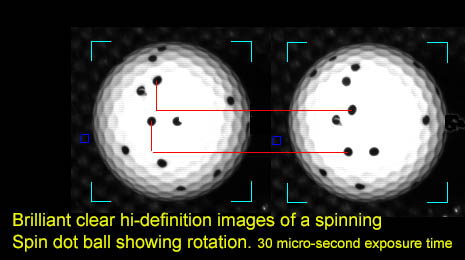
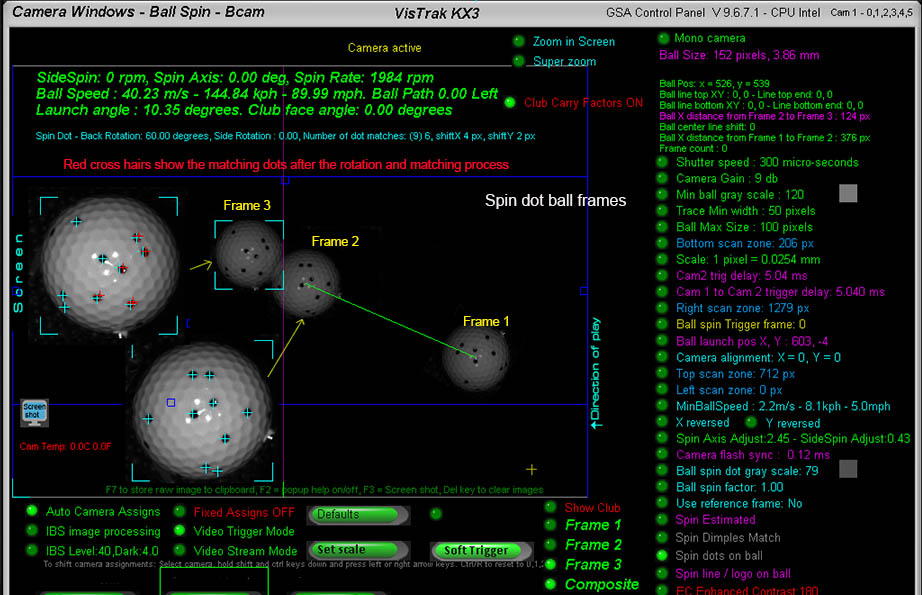
Ball spin detection images
Side view of ball spin rotation
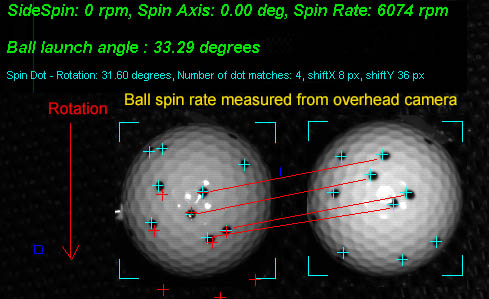
Overhead top view of spin rotation
Images were captured with IR Xenon flash and camera exposure down to 25 micro-seconds
Spin dot image processing method.
1. Detect ball in both frames
2. Detect all spin dots with coordinates in both ball images
3. Translate all spin dot coordinates to an origin
4. For side view camera: Rotate spin dots in frame 2 in 1 degree steps thru 360 degrees
For top view camera, shift spin dots down in frame 2 in 1 pixel steps
5. For each step, run a dot matching routine to see if the spin dot pattern matches in both frames and store match result
6. Search match result table for best match.
For side view camera: the degrees of rotation are the best match result
For top view camera: vertical pixel movement has to be converted to degrees.
7. Convert rotation in degrees with frame timing to rpm.
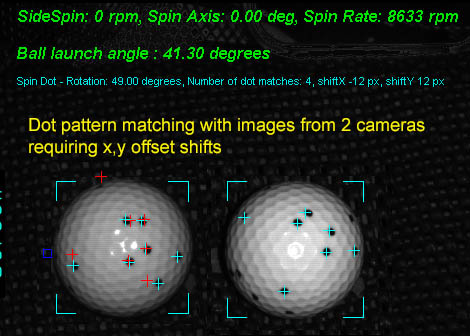
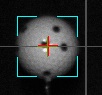
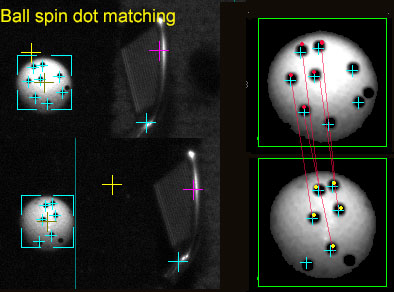
As spin detection with the GSA Golf side mounted system is using 2 cameras to capture the images of the spinning ball,
a direct dot pattern match using just image rotation alone won't always work as the cameras are viewing the ball from slightly different angles.
To fix the problem, image shift on both the x and y axis is also required in the dot matching process.
The above image shows a dot pattern match from the 2 ball images after both rotation and x,y offset shifts.
The red cross hairs in the ball image 1 are of the spin dots in ball image 2 after rotation and x,y shifting.
Note that dots on the perimeter don't always line up and match but that's not an issue as the ROI (Region of Interest) is only around the middle of the ball.
Images were captured with IR Xenon flash and camera exposure down to 25 micro-seconds.
Measuring ball spin with spin dot markings
The big advantage of using balls with dot markings around them, is that you don't have to bend down and align the ball logo to the camera for every shot.
i.e. you can just place the ball on the hitting surface willy-nilly - guiding it with your club or foot - and the system will still detect the correct spin rate and axis
The advantage of using marked spin dot balls
The main advantage of using spin dot balls is that you don't have to bend down and adjust the ball so that the ball logo or the applied metallic dot is facing in a certain direction.
BTW from what I gather, Trackman and Mevo systems do require you bend down and adjust the ball so that their metal dot - that you are required to apply to the ball - is facing upwards or in the direction of play.
Another advantage is that you can visible see and thus verify the rate of rotation during the video swing playback with visible ball markings.
In contrast, you won't see this if the ball has no markings so you'd have to just believe that the measured ball spin rate is correct.
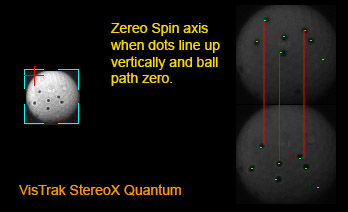
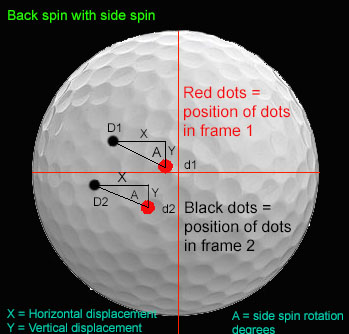
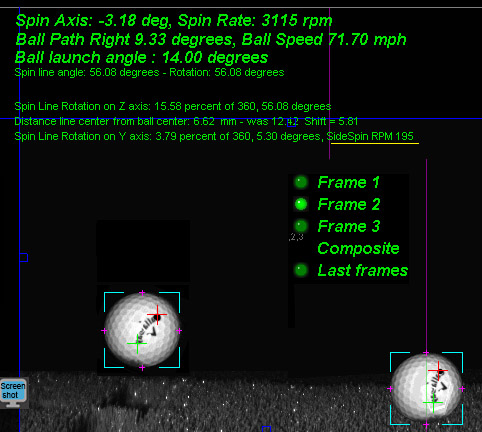
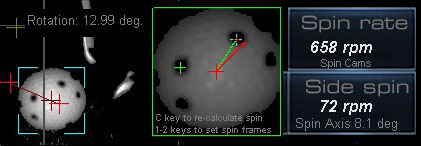
Spin axis and side spin
As we all know, there's no such thing as side spin but the camera does see horizontal rotation (side spin) as well as vertical rotation (back spin).
As the camera sees the two 2D images of the ball, it would look like the ball is rotating in 2 directions at the same time but that is only due to the spin axis being tilted.
Camera tests revealed that as long as the ball is struck square to the club path (no matter if path is straight, in-to-out or out-to-in), then no side spin or spin axis tilt is imparted on the ball.
If club face differs from club path, then side spin and axis tilt can be detected.
Spin axis
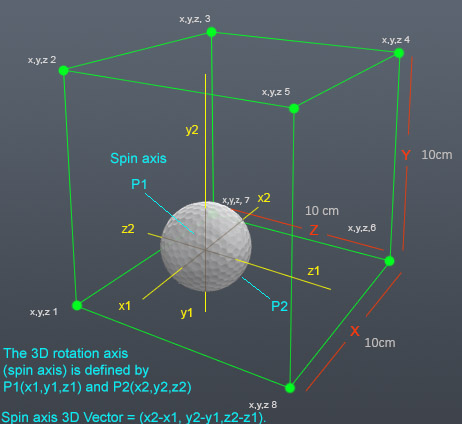
As ball spin axis is 3 dimensional, it cannot be shown as a simple number of degrees.
in order to actually show spin axis, you'd have to calculate a 3D vector which the average golfer wouldn't easily comprehend.
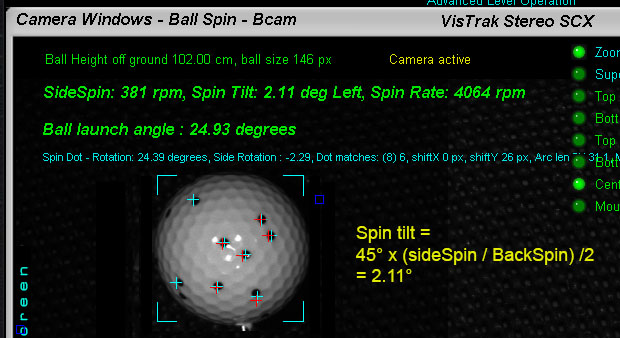
Spin tilt - on the other hand - is simple to understand as it can be shown as a number of degrees.
To calculate spin tilt, a ratio of Side Spin to Back Spin is used.
e.g.
if Side Spin is the same as Back Spin (i.e. 100 %) , then the ball will be spinning at a 45 degree tilted angle.
if Side Spin is 50% of Back Spin , then the ball will be spinning at a 22.5 degree tilted angle. etc, etc ...
The above shown simple equation is used to calculate the spin tilt.
i.e. side spin 381 / back spin 4064 = 0.09375 / 2 = 0.046875 x 45 = 2.11 degrees spin tilt
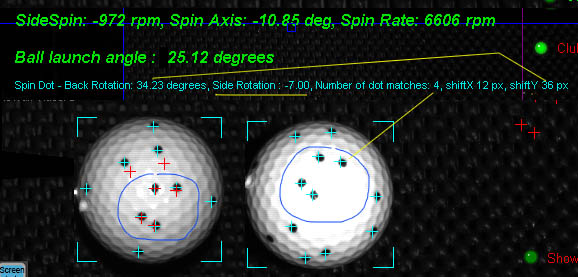
As spin axis is 3 dimensional and the cameras are 2D, spin axis itself cannot be directly measured .
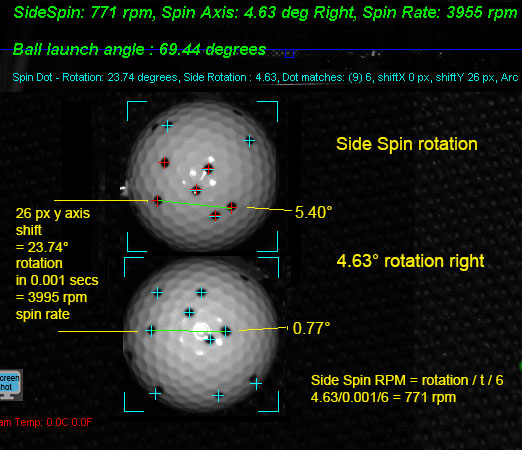
However, side spin (i.e. ball side rotation as viewed from the overhead camera) could be measured.
In the above test images, the dot pattern could be seen to have shifted downwards (for back spin) and also rotated some -7 degrees.
Side spin to spin axis conversion is thus required for those golf game software systems that use spin axis.
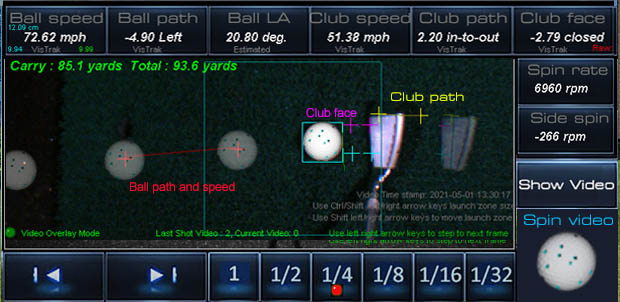
In addition to the regular ball and club shot video, a separate ball spin video is now also shown.
VisTrak Vcam Spin Axis tilt
The above method of measuring spin axis tilt from the floor mounted VcamSpin system is currently being tested
VisTrak Vcam Spin Axis tilt direction
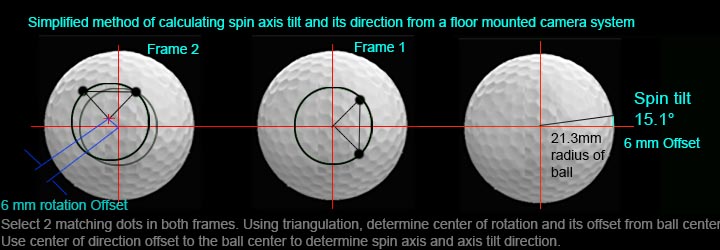
In order to determine the spin axis tilt direction, 2 matching dots in each frame will be required.
VisTrak Side Spin direction
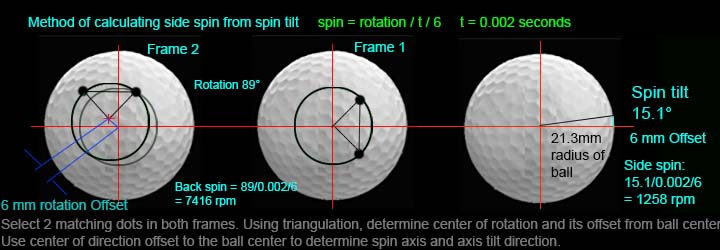
The above shows the method used to calculate side spin from spin axis tilt.
VisTrak SCX ball spin measurement testing
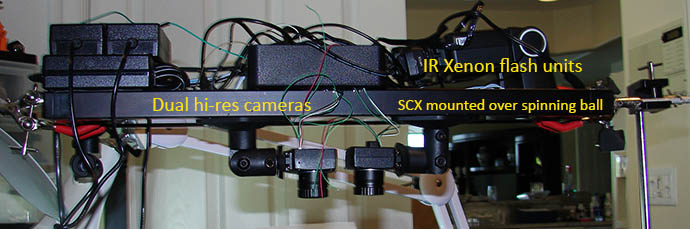
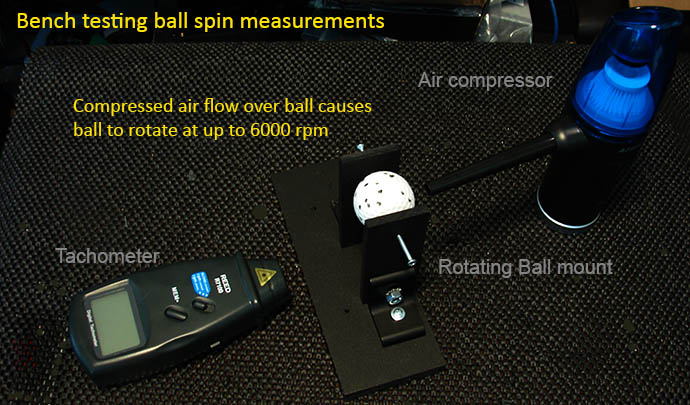
The above images show the bench test setup for testing the accuracy of the ball spin cameras used in the SCX.
Comparisons between the tachometer read out of the spin rate and the SCX's calculations will be made over a number of different spin rates.
As the tachometer doesn't see spin dots on a white ball, a separate black ball with a single white strip on it had to be made in order for the tachometer to measure spin rates.
VisTrak Vcam Spin, LX and KX ball spin measurement testing
In contrast to the SCX - that sees the ball from overhead - the ball spin cameras in the Vcam Spin, LX and KX3 systems view the ball from the side.
As the amount of rotation is plainly visible in the ball images with these systems, verification with a tachometer should not be required.
VisTrak Vcam Spin

The Vcam with EVi systems view's the ball from the side.
Rotation - when using spin dot balls - is calculated around the center of the ball between frames
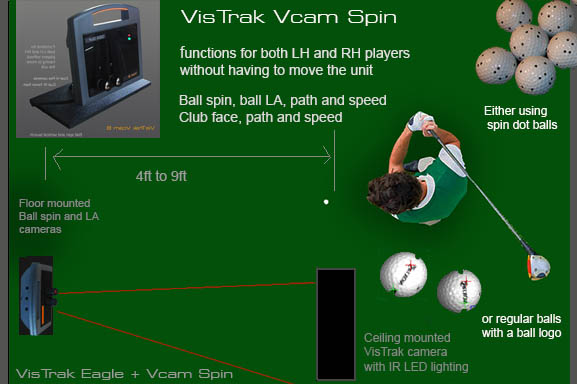
In particular, the ability to measure ball spin axis tilt by detecting the center of rotation via the spin dots or ball logo.
Spin axis tilt
The VcamSpin system also measures the spin axis tilt by detecting the center of rotation of the spin dot pattern.
Measuring ball spin without ball markings - the complete process explained
Ball spin detection without ball markings
It should be noted that in order to detect ball spin with balls that have no markings on them, high resolution images of the ball that clearly show the dimple patterns are required.
While the regular VisTrak hi-speed - but low resolution - camera works just fine when clear markings are on the ball,
the ball images do not have sufficient resolution to clearly show the dimple patterns.
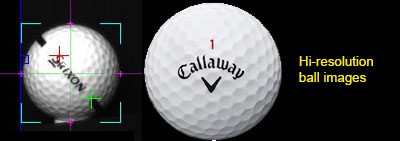
In order to obtain hi-resolution images of the ball in flight, the camera has to be set to hi-res mode and an IR-Xenon flash is required.
So, while it's great that we now have the proven code process that detects ball spin without ball markings, we don't - as of yet anyway - have the hi-resolution images.
As stated before, the IR Xenon hi-resolution camera systems are expected to be ready in the 1st quarter of 2023
Ball spin detection without ball markings
Amazingly accurate results using test ball images
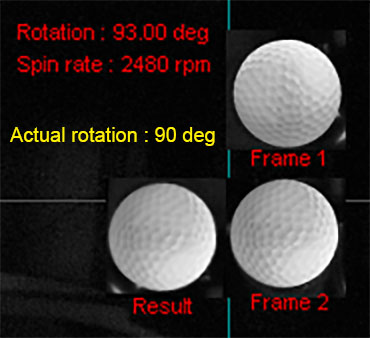
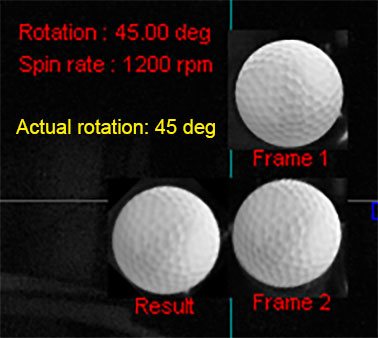
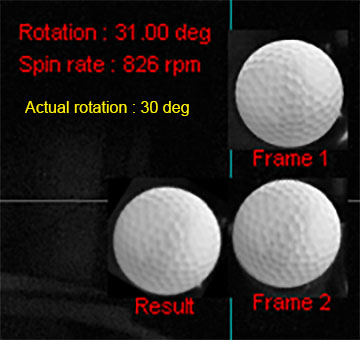
Are these results too good to be true?
The test method used here is to take a ball image and paste it into a VisTrak frame 1 using Photoshop.
Then rotate the ball image a certain number of degrees and paste it into frame 2.
Then load the frames into the CP and run the images through the spin calculation process.
The spin calculation process rotates the ball image in frame1, one degree at a time, and compares it to the ball image in frame 2.
The comparison process subtracts each and every pixel gray scale level from the ball image in frame1 from the level in frame2, and the result is stored in a "degree match" table.
We then just have to search the "degree match" table for the best match result to get the number of rotation degrees.
Knowing the amount of rotation within a certain frame time allows us to determine the ball spin rate.
My question at the moment though is "to what extent is the non-uniform lighting" effecting the results?
More tests using the VisTrak side camera are thus required.
Nevertheless, I'm very happy with these results. Almost fell off my chair when seeing the results this morning in fact.
Xenon flash timing for SCX and VcamSpin (EVS) systems
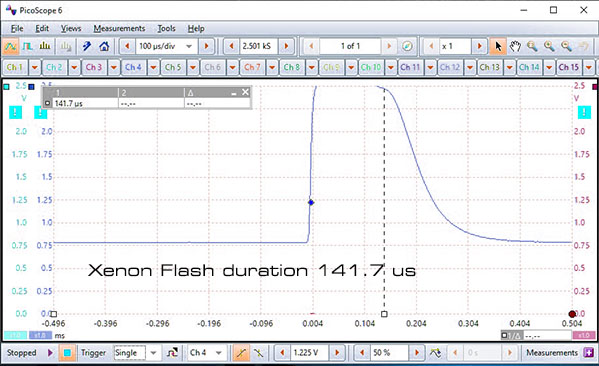
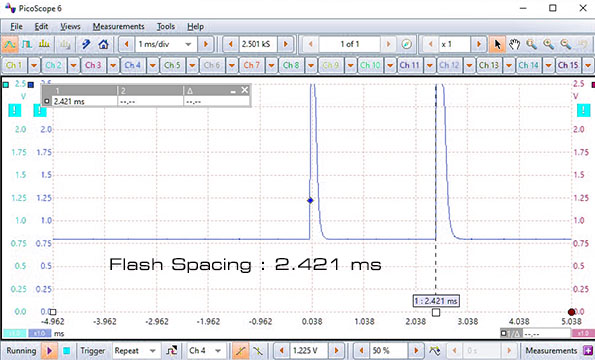
The above Xenon flash scope images were derived from an optical sensor hooked up to the oscilloscope.
They show flash duration and the flash timing between the 2 ball spin cameras.
Assuming we want to measure up to 10,000 rpm then:
Revolutions per second are 10,000 rpm / 60 = 166 rps.
Revolutions per Milli second = 166/ 1000 = 0.166 rpms.
and finally revolutions per 2.421 milli seconds are 0.166 x 2.421 = 0.4 rpms.
which work out to be around 145 degrees (360 * 0.4) of rotation between frames.
While this is just fine if the camera system is viewing the ball from the side as a full 360 degrees of back spin can be viewed,
but when viewing the ball from above, only around half that (i.e. 70 degrees) of rotation can be viewed before the dot pattern rotates out of the FOV of the cameras.
Thus fame and flash spacing has to halved (i.e. around 1.0 ms) for overhead ball spin camera systems.
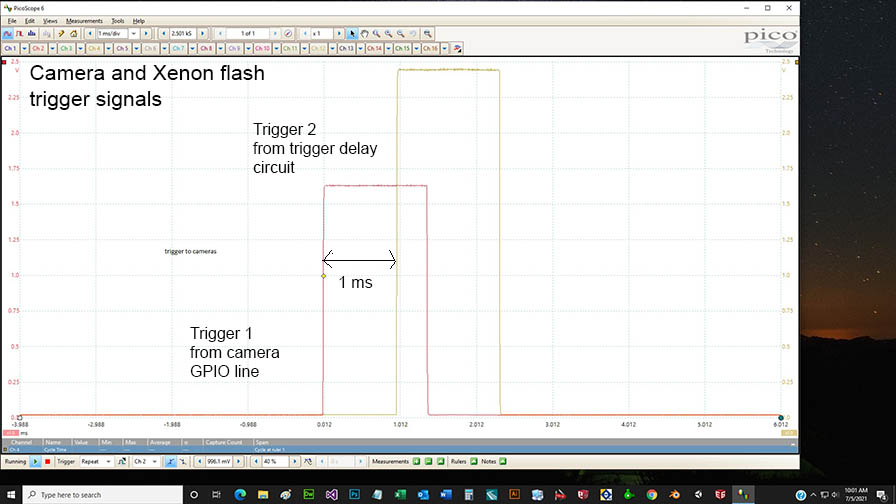
The above oscilloscope image shows the camera trigger timing required for overhead ball spin detection .
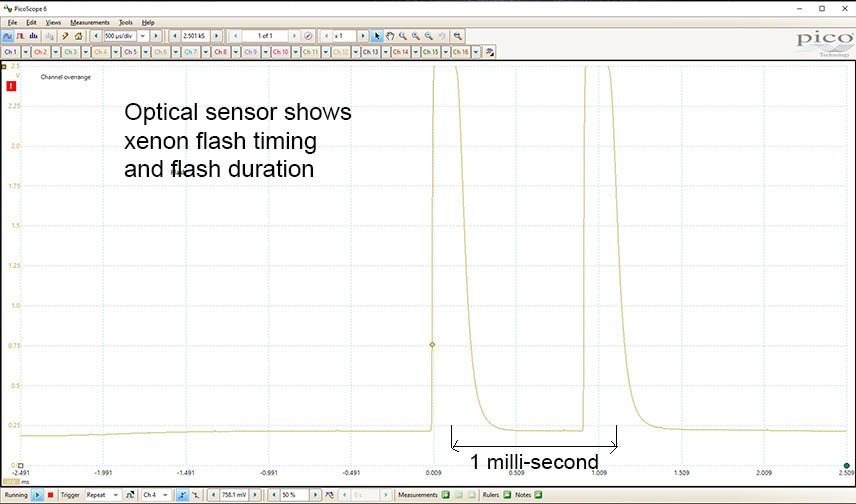
While this oscilloscope image shows the flash duration and timing required for overhead ball spin detection .
SCX Xenon flash control circuit board
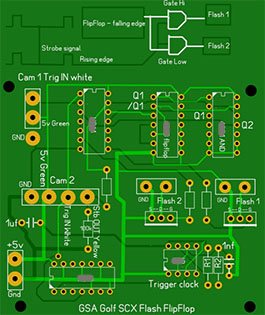
This circuit board controls 2 Xenon flash units for the SCX dual ball spin frames
The SCX right camera will send out a strobe signal for each frame. The first strobe fires flash 1, and then (via a flip flop circuit) fires flash 2.
VisTrak Stereo Spin / SCX data capturing method
1. The VisTrak camera detects when a ball is placed in the launch zone area
2. When a ball is detected, the stereo cameras are triggered to grab frames of the ball at the launch position.
3. The VisTrak camera is then placed in full speed mode (590 fps) while constantly checking to see if the ball moves forward.
4. As soon as the ball moves, (strike frame) a trigger signal is sent (via a GPIO line) to the stereo cameras
5. The stereo cameras are programmed to delay any trigger signal by 5 milli-seconds and 5.1 ms
6. The Stereo cameras then detect the height the ball is off the ground and calculates the launch angle and the spin rate based on the ball's rotation within 0.1 ms
7. The ball path - left or right - is detected by the VisTrak camera as is the club speed, face angle and club path
8. The ball speed is then calculated from the distance the ball has traveled from the ball strike frame in the VisTrak camera and the ball's position in the stereo cameras.
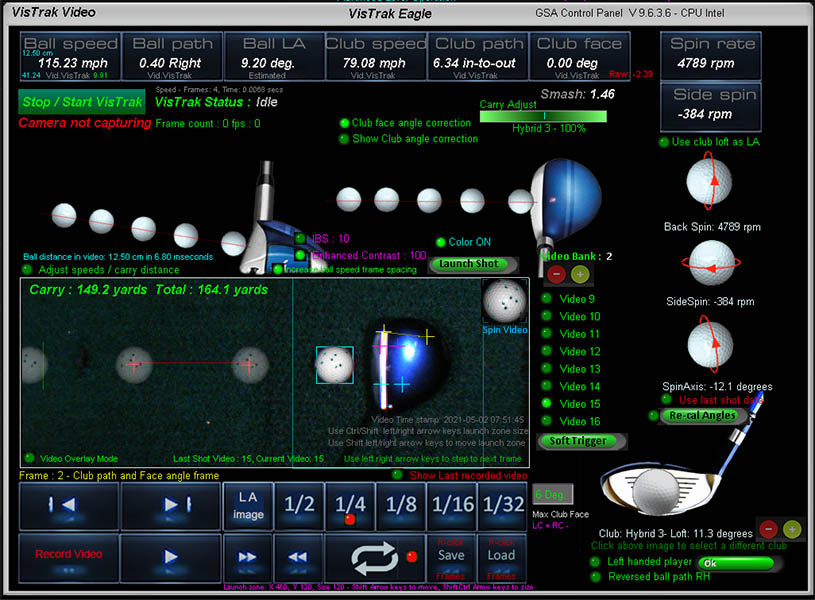
Measurung ball spin using the ball's logo
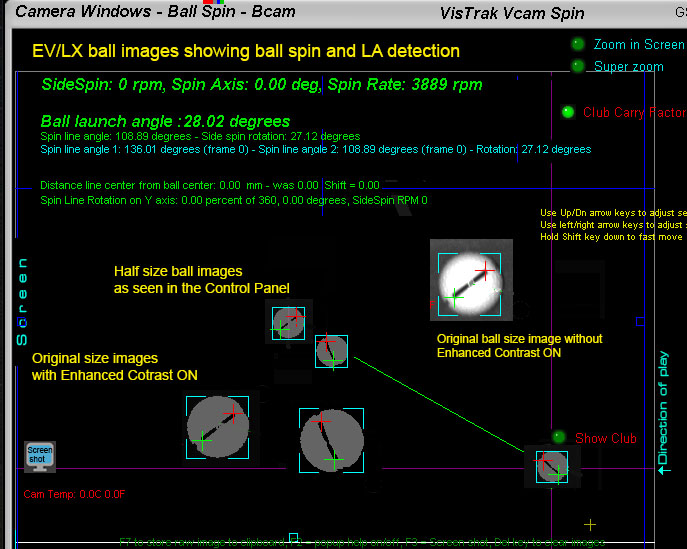
The above image shows how precise the VcamSpin system is at capturing both ball spin and LA with its hi-resolution and hi-speed cameras.
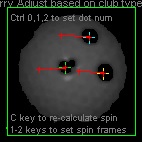
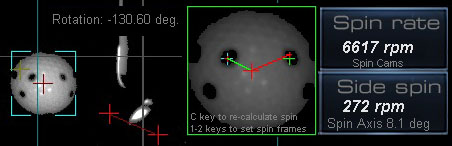
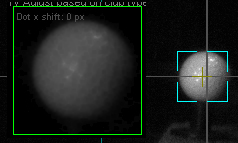
Spin dot ball testing with the ceiling mounted SCX cameras
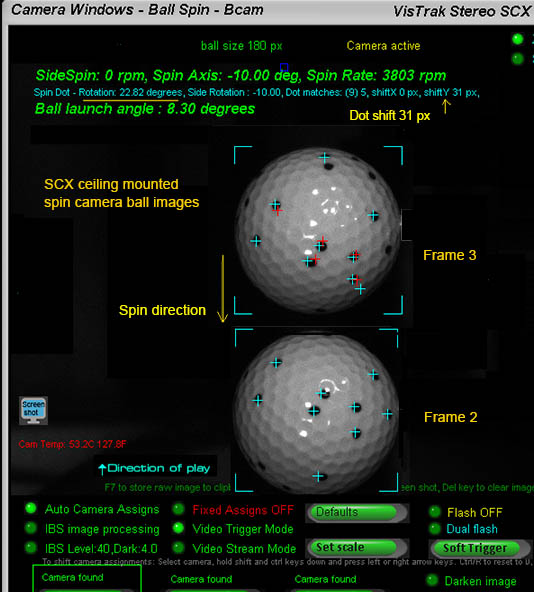
In order to measure ball spin from ceiling mounted cameras, close up hi-resolution images of the spinning ball are required.
The image shows that the ball dot markings shifted back 31 px which equates to a 22.82 degree of rotation within the 1 ms time frame
which in turn equates to a spin rate of 3803 rpm.
Spin dot ball testing with the floor mounted KX3 and VcamSpin cameras
The same tachometer test as yesterday was made using spin dot balls instead of ball's with a logo on them today.
After a few minor tweaks, all worked out just fine and tachometer readings matched the CP's readings.
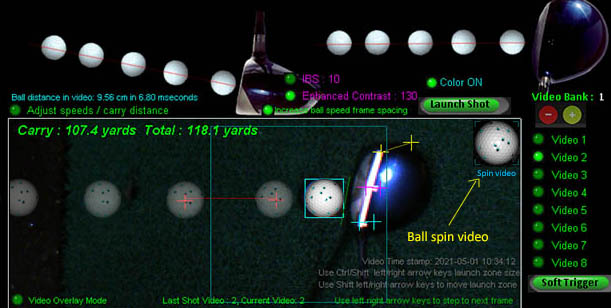
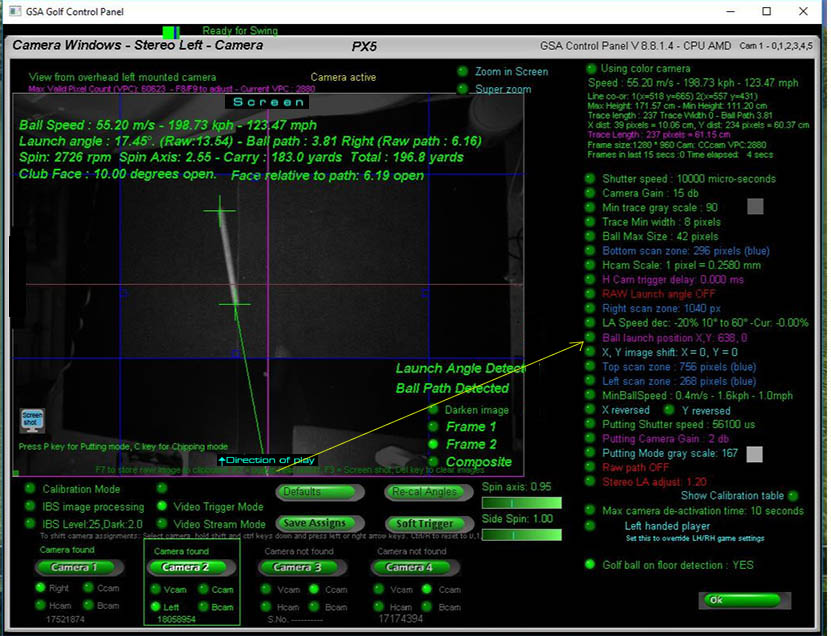
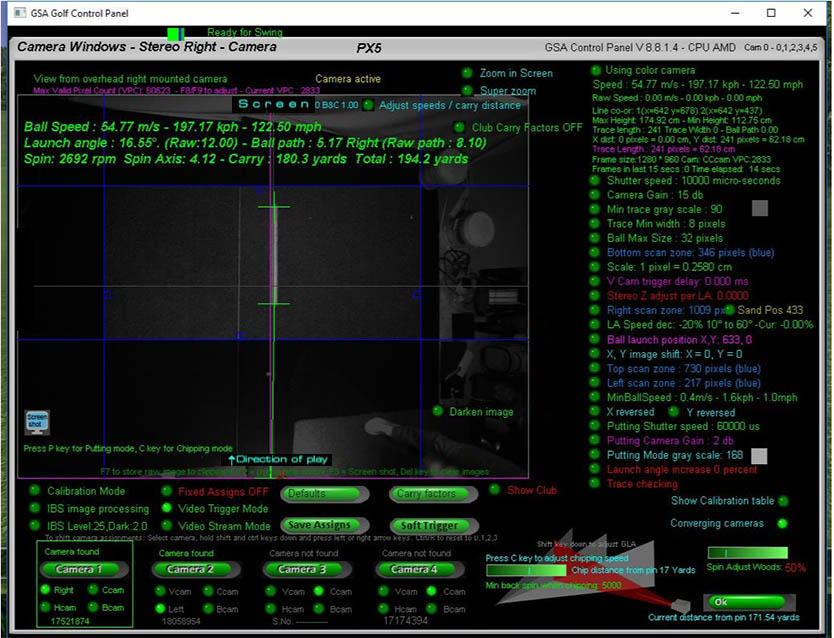
"Speed Triggers"
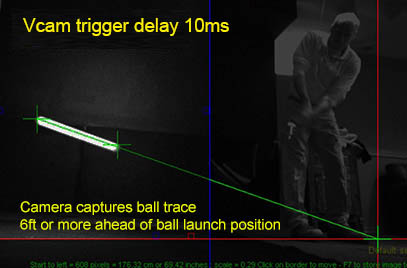
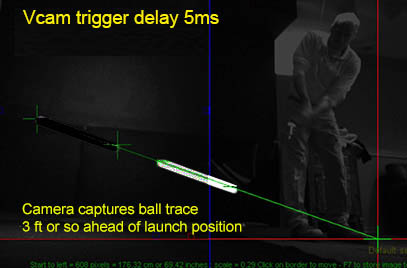
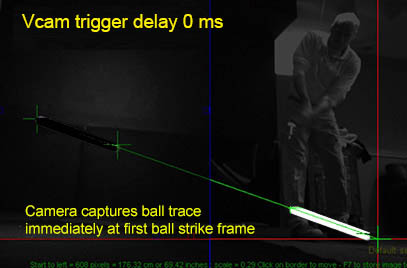
The new "Speed Trigger" method of delaying the Vcam, Stereo or Ball Spin camera triggers will solve a major issue that the current fixed method of delaying the trigger has.
Namely: the ability to capture images of the flying ball at a set distance from the ball strike position.
The above images illustrate the issue when using a fixed trigger delay.
Depending on the speed of the ball, the captured images of the ball or ball trace are not in a fixed position. i.e. they can appear anywhere in a large FOV.
In order to correct this, a speed dependent trigger delay is required that reduces the trigger delay for high speed shots and automatically increases the trigger delay for lower speed shots.
Using this "Speed Trigger" method, the ball or ball trace will always appear within a small (3ft or so) area.
While this is not so critical for detecting Vcam ball traces (as shown above), it is of paramount importance when capturing high resolution images of the ball for ball spin detection
using 25mm zoom lenses that have a very limited FOV.
Using this method also eliminates the requirement to use a Line Scan trigger camera with VisTrak Stereo LS systems as the effect is similar to a Line Scan trigger camera.
Of course, in order to vary the trigger timing on the fly, the ball speed must be known beforehand.
To do this, a super fast and easy method of ball speed detection has been devised that measures ball speed within the VisTrak frames as they are being captured.
An additional feature is that the user can set and vary the distance the ball is captured from the ball strike position
so that it is consistent for all ball speeds - from small 10 mph chips to full 200 mph drives.
BTW - for those that are interested - this feature is capturing linear ball speed (i.e. the rate at which the ball is moving forward - irrespective of its vertical launch angle)
and not true ball speed that requires that the vertical launch angle be known.
Thus, knowing the rate at which the ball is moving forward and the desired ball image capture distance is from the strike position,
allows us to calculate how long to wait until this desired distance can be reached.
Note: True ball speed is then calculated after the system has acquired the vertical launch angle.
Also note that when using this feature,
any user defined camera internal trigger delays are set to zero as the trigger delay is then controlled by the CP's SpeedTrigger software function.
Comparison of Ball image size VS Stereo disparity methods of vertical launch detection
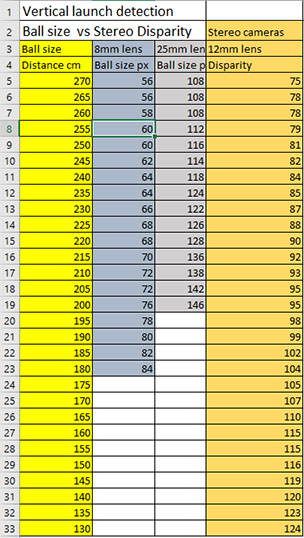
The above table shows the comparison results of the Ball Image Size VS Stereo Disparity methods of ball vertical launch angle detection.
i.e. for a ball at various distances from the cameras.
While at first glance there's not a great difference in the two methods, the stereo disparity method has one big advantage though.
Namely: Disparity values don't differ when the ball path is left or right, whereas, ball image size will differ greatly with varying ball paths.
i.e. the ball image size will get smaller the further it is away from the cameras and not match up to the ball image size if going straight.
So in order to use the ball image size method of detecting the height of the ball (and thus be able to calculate the vertical launch angle)
the ball image size has to be adjusted in accordance with the ball path.
So what is really required, is the distance the ball is from the camera before we can calculate the ball height.
Measuring ball data with stereo cameras
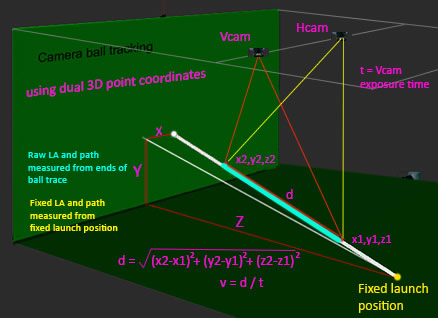
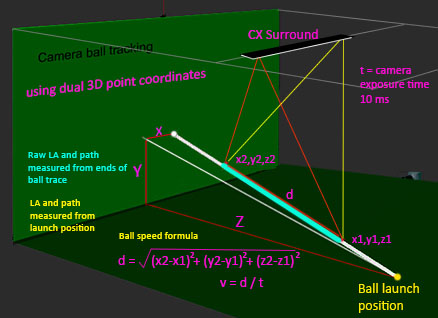
Stereoscopic vision explained
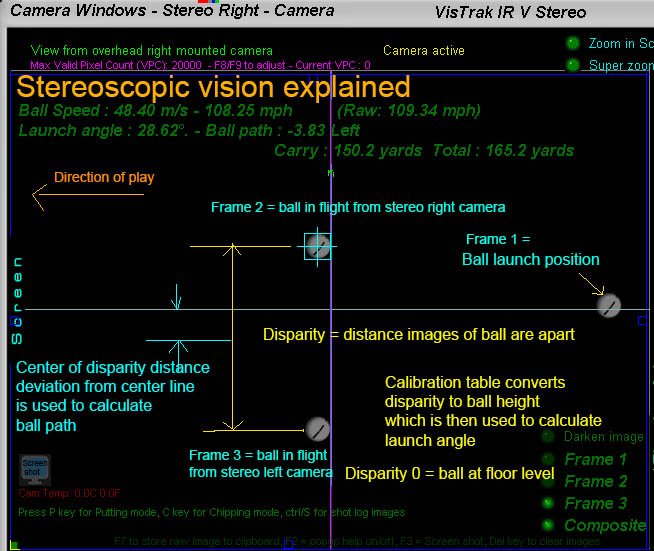
The above diagram explains the basic stereoscopic principles.
Note: the above diagram shows the stereo cameras for the VisTrak IRV Stereo where the direction of play is from right to left and not from bottom to top as with the regular VisTrak Stereo system.
If the two 2 stereo cameras are aimed precisely at the center line and a ball is placed at floor level, the images of the will appear on top of each other.
The disparity of the ball is then zero (or near zero) and this is known as the "Converging point"
When the ball is elevated, the images of the ball in the camera frames will start to separate. The distance the ball images are apart is the "Disparity".
Using a "disparity to ball height" table and with weighted calculations, the exact height of the ball can be determined.
Knowing where the ball was before ball strike (frame 1) and the trigger delay time on the stereo cameras, the ball LA, speed and path can be determined.
Ball path is simply derived from the divergence the center of the disparity distance is from the center line.
i.e. a perfectly straight shot would show that the 2 ball images are the exact same distance from the center line.
Converging camera test shots
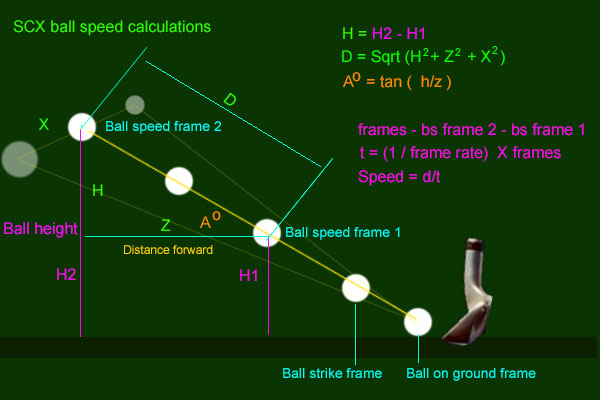
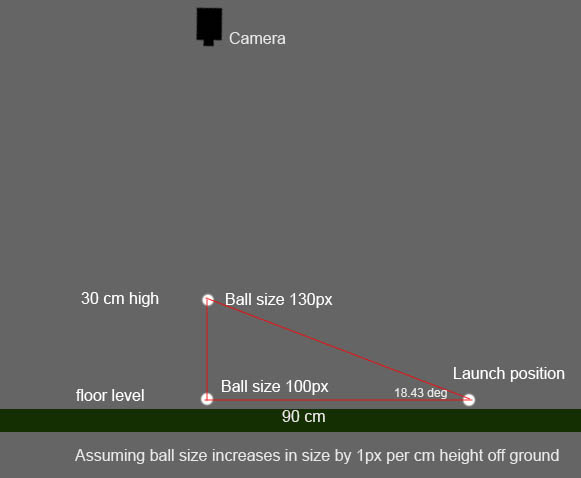
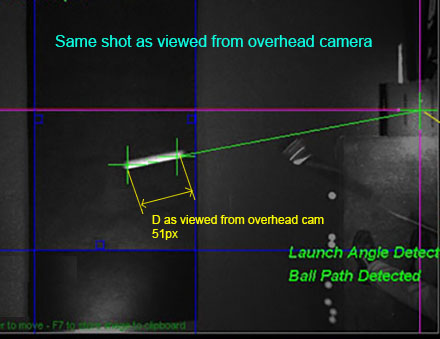
Measuring ball speed from an overhead cam vs a side mounted cam.
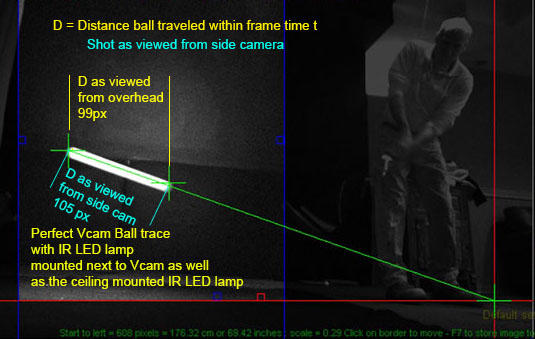
Measuring ball speed from a side mounted cam (as with a floor mounted launch monitor), is quite straight forward.
Other than path deviation, the distance the ball has traveled during the camera exposure time or frame time can easily be measured.
Measuring ball speed from a ceiling mounted camera requires more calculations as the apparent distance the ball has traveled will be distorted.
i.e. the higher the launch angle, the shorter the distance will appear.
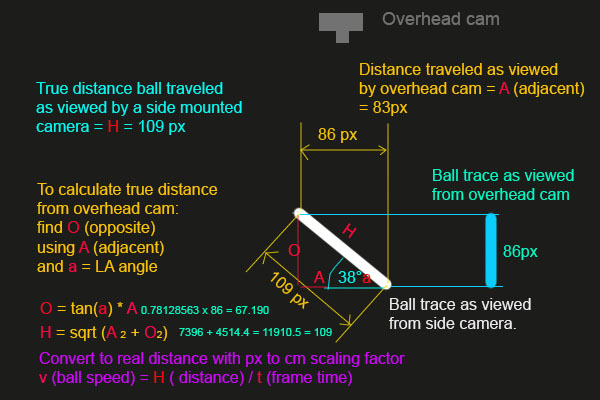
The above diagram shows how to obtain the true distance from the overhead camera.
GSA Golf tracking system accuracy
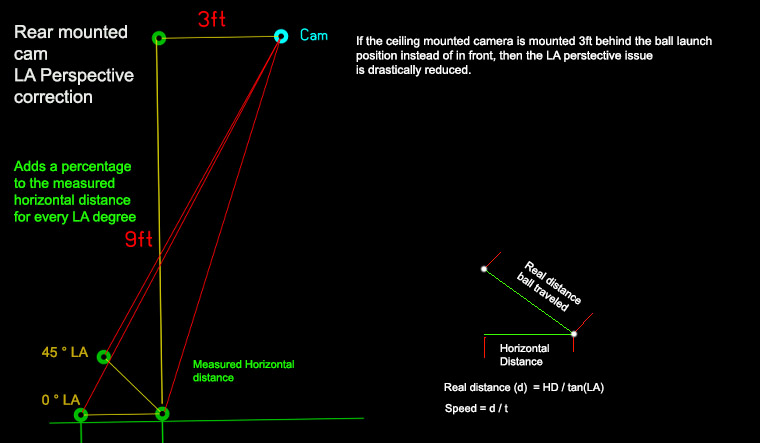
Overhead camera perspective correction
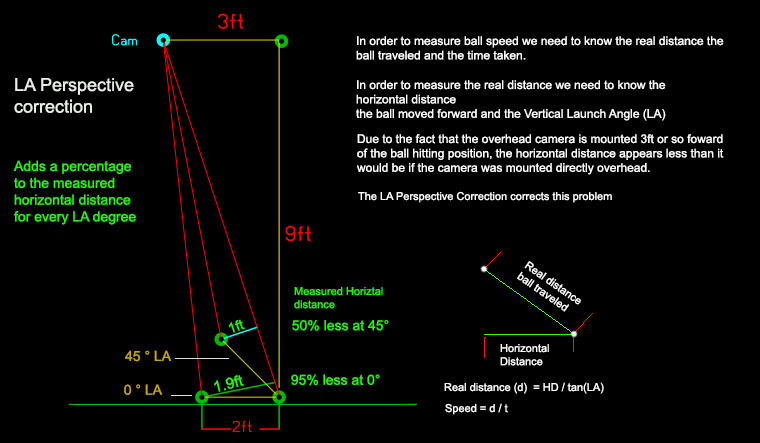
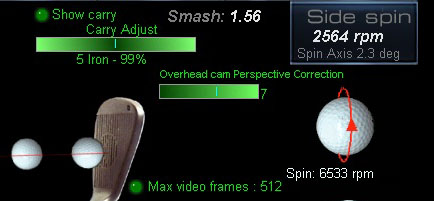
The perspective correction is currently user definable in the Video panel.
Set the slider bar to zero for no correction.
Numerous hours have been spent over the past days checking the accuracy of the VisTrak systems.
All math calculations have been confirmed to be as accurate as can be,
so if the game software is not showing carry distances that are consistent with the users expected carry distances,
then one of the following could be the cause.
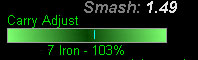
1. A CP carry or ball speed factor has been applied. (either negative or positive).
Ensure all ball speed and carry factors are set to 100%.
Press shift R in the club dependent Carry factors window to set all carry factors to 100%
 -
- -
-
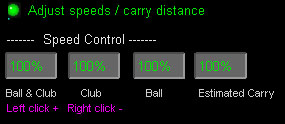
Click all global carry factors to 100% in the "Adjust speeds / carry distance" window.
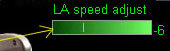
Set the LA Speed adjust to 0.
2. The system you are using doesn't feature Vertical Launch Angle detection
True accurate ball speed detection is not possible without accurate vertical launch angle detection.
However, reasonably good ball speed results are obtained using the either the selected club loft or user defined club loft as the vertical launch angle.
3. The system is not detecting the ball from one or more of the cameras correctly
i.e. the system is picking up other objects in the FOV of the camera that is not a ball.
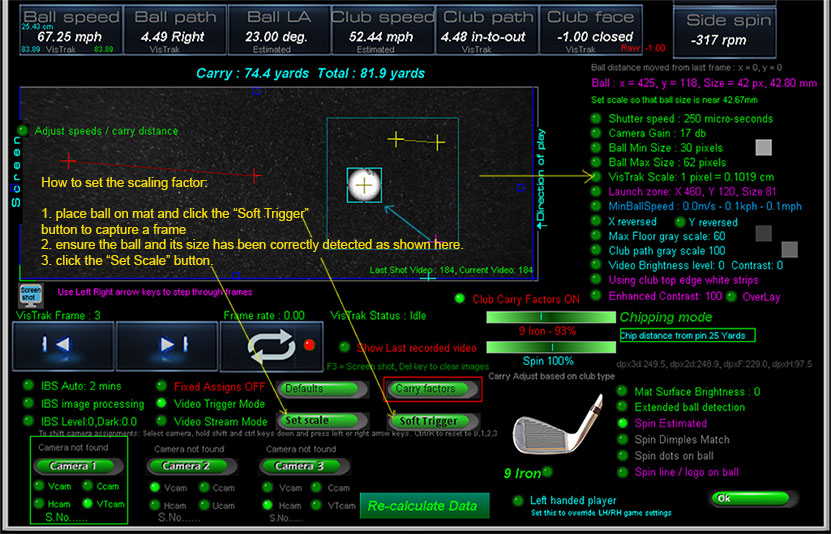
4 The scaling factor hasn't been set correctly
If the scaling factor is not set correctly, then measured ball speed will be totally incorrect.
The scaling factor is used to convert measured distances in pixels to real world distances in meters (cm and mm)
Use the "Set scale" button to set the scale after a stationary ball has been detected on the mat.
The scaling factor is a global speed adjustment factor for all clubs and only has to be set once during the system setup.
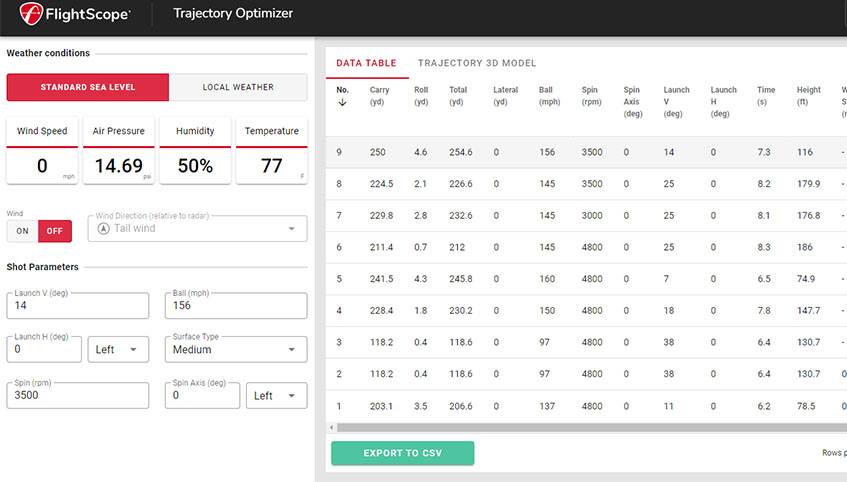
FlightScope Trajectory Optimizer
 update10255
Using this online app, you can see what carry you would obtain based on various input parameters such as LA, ball speed and spin rates.
Click the above image to go to the app.
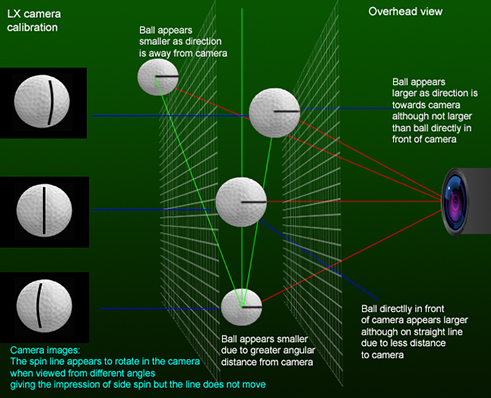
Camera calibration
The floor mounted LX detects ball path (direction left or right) by comparing the ball image size of the ball before ball strike to that of the ball in flight.
i.e. if the ball image size increased in size, the ball got closer to the camera and thus path is right.
Vice versa, if the ball decreased in size, then the ball is moving away from the camera and thus path is left.
However, due to camera lens distortion, ball image sizes have to be corrected depending on where the ball is in the image
in order to achieve a realistic result which requires checkered board calibration.
BTW the SCX automatically calibrates itself every time a ball is detected on the tee or floor before ball strike.
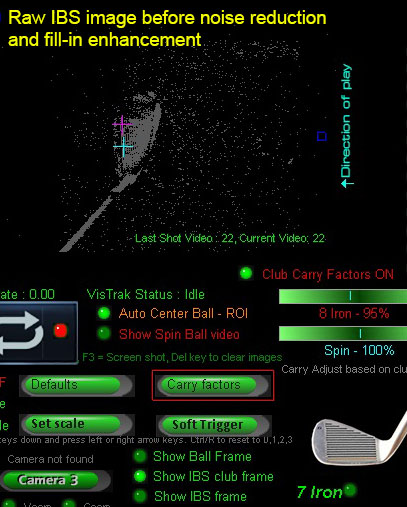
Detecting club data (path, face angle and speed) without markings
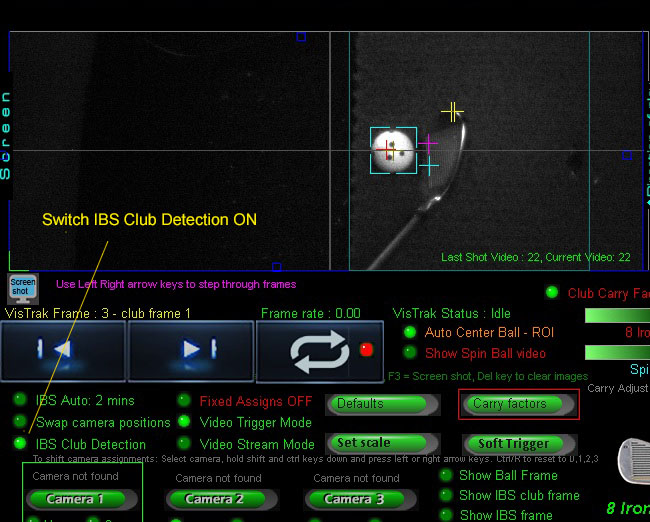
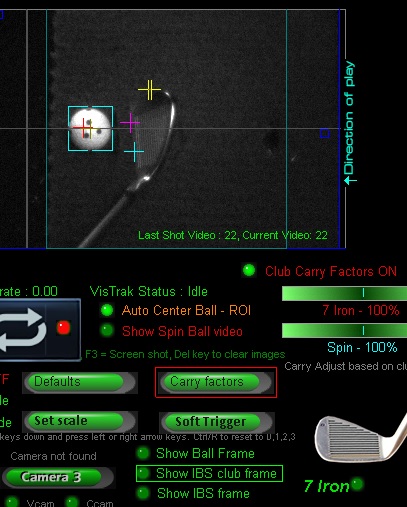
All club data is now derived from the IBS club frames including face angle, path and speed

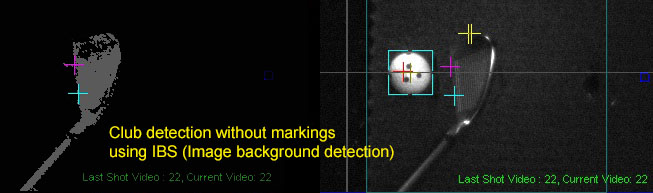
Results of the new advanced club detection method that detects club data without markings
 ---
---
 ---
--- -
-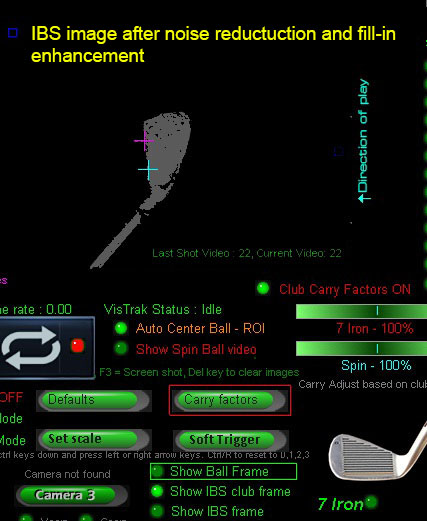
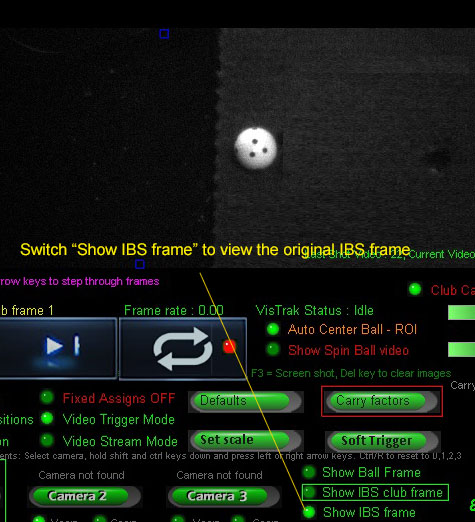
Using IBS (Image Background Subtraction), the method entails subtracting a frame image of the mat before ball strike (some 8 frames back in the video sequence)
from the frame image of the mat just before ball strike. The result leaves a clear binary image of just the club.
![]()

![]()

![]()
 Home
Home Sensors
 Cameras
 Software
 Enclosures
 GSA Courses
 E6 Courses
 Business
 Tech News